Os dados já existem. Now turn it into decisions.
We connect financial, commercial, operational and people data to create indicators, dashboards, alerts and analyses that help management see what is happening and act earlier.
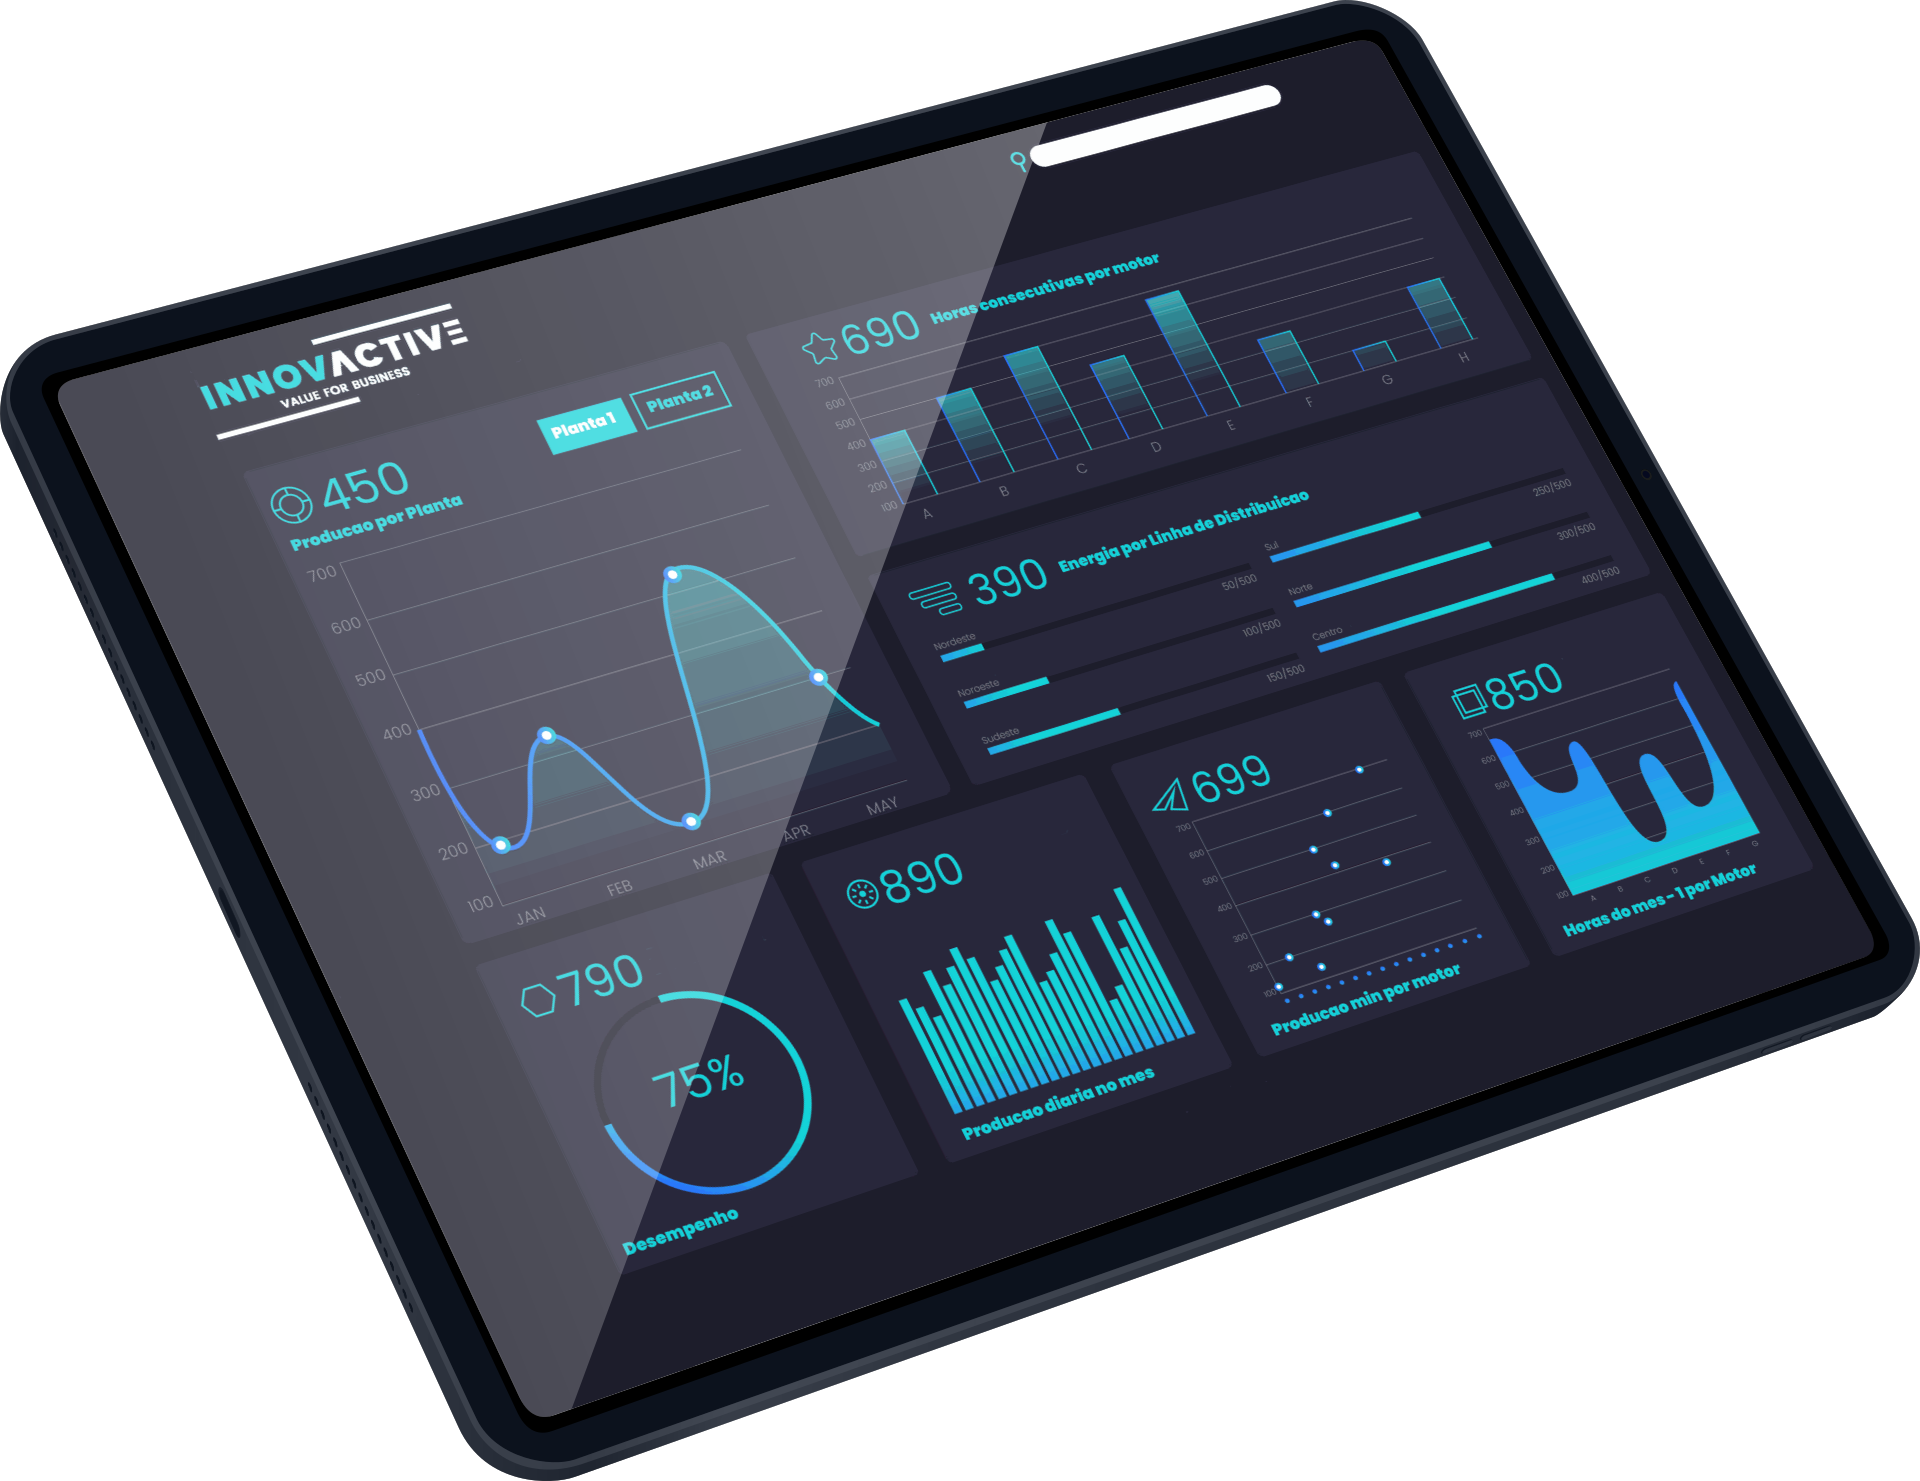
A consolidated view for earlier decisions
Fewer manual reports, fewer versions of the truth and greater ability to act on real deviations.
Having data does not mean having useful information
Many organisations already record almost everything, yet decisions still come late because information is fragmented, inconsistent or trapped in manual reports.
Manual reporting
Hours spent compiling, correcting and validating figures.
Multiple versions of the truth
Different departments present different figures.
Late information
The problem only becomes visible after it has already affected results.
Limited visibility
It is difficult to see quickly where action is needed first.
BI should answer the questions that drive the business
- Where are we gaining and losing margin?
- Which customers buy more, pay better and generate more value?
- Which products remain in stock for too long?
- Where are the largest cost deviations?
- Which invoices are ageing and putting pressure on cash flow?
- Which teams or business units are performing below expectations?
- Which projects are consuming more time and resources?
- Which risks require action before they grow?
One integrated view, even when data lives in different systems
Information may be distributed across ERP platforms, operational systems, spreadsheets, banks, specialised applications, databases and external services. The first step is to connect it and give it meaning.
Each team sees what it needs to act
The same data can provide different views for Executive Management, Finance, Sales, Operations and People.
Executive Management
Results, targets, deviations, liquidity, growth, risk and overall performance.
Finance
Revenue, costs, margins, collections, cash flow and budget execution.
Sales
Pipeline, sales, customers, conversion, margins, targets and team performance.
Purchasing and Inventory
Stock, turnover, shortages, excess inventory, purchasing, suppliers and service levels.
Human Resources
Headcount, attendance, costs, productivity, training and team development.
Projects and Operations
Deadlines, hours, costs, maintenance, productivity, utilisation and quality.
You do not need to replace the systems that already work to gain an integrated view
We start with what the organisation already has and build the architecture required to turn dispersed data into useful information. Odoo may be the central platform, one of the data sources, or may not even be part of the first phase.
When data is sufficiently organised, we can build indicators, analyses and reporting directly on existing systems, avoiding additional technology where it is not needed.
When information is dispersed, we integrate systems, databases, files and APIs to build a coherent, organisation-wide view.
For greater volume, history or complexity, we can introduce an analytical layer or Data Warehouse and deliver information through Odoo, Python, Power BI or customised reporting.
Technology comes after the need. Innovactive connects business, data and technology to select a solution proportionate to the problem: from analysis within Odoo to a multi-system architecture with integration, Data Warehouse and Business Intelligence.
Business Intelligence before it became just dashboards
Our team's experience in Business Intelligence and management information predates Innovactive itself and includes participation in information systems and BI initiatives in complex environments, including the Public Finance context.
That experience shapes how we work today: we start with management questions, the quality and meaning of the data, and the decisions that need to be supported. Only then do we choose the technology and the best way to present the information.
A beautiful dashboard does not solve a management problem
To create value, every indicator needs a clear definition, reliable data, accountability and an associated action.
Clear indicator
Everyone understands what it measures, where it comes from and why it matters.
Reliable data
The source, quality and update frequency are controlled.
Clear ownership
Someone has the authority to monitor and act.
Associated action
A deviation triggers an alert, decision, priority or follow-up.
We start with decisions, not charts
Management questions
We identify the decisions, risks and results that require visibility.
Sources and quality
We validate data, structure, consistency, frequency and ownership.
Indicators and prototype
We build an initial view to validate usefulness and interpretation.
Deployment and evolution
We deliver, train users and improve based on real use.
Which decisions still depend on Excel, phone calls or manually prepared reports?
Show us the decisions you need to make and the information that is difficult to obtain today. We assess the existing data and propose the simplest path to turn it into control, analysis and action — using what already exists first and adding new technology only where it creates value.